
SKU Profitability
In order to run a successful business, profitability is a key driver. This would assume that most businesses have a very good handle of what products add to that profitability. Unfortunately, with the many moving parts of FMCG, it can be difficult to know which products are contributing to (or reducing) your overall profitability. Mars probably have a very good understanding of the true cost to make a Mars Bar, however this product has been around 97 years, where as most FMCG businesses churn SKUs annually.
Generally speaking products have been priced correctly, cost allocation principles maintained, a few products have been added with some slight variations for your valued customers and as you took an opportunistic prospect to provide for a client when a competitor could not, bespoke transport arrangements were required. Individually these impacts will not move the dial significantly but over time the profitability of the product portfolio has been eroded.
Often product costings are copied from similar products, but how often are the copied standards validated? Do this once and you may only see a 10-15% variance, however over the years this variance will compound to the point where copied standards significantly different from reality, leading businesses to make decisions on information that is simply wrong. What seemed like a record-setting month can often turn into a nightmare once the P&L is finalised.
With the right structure, allocation and bottom up understanding this information could be at your fingertips, not just showing the correct profitability for each SKU but also:
- Focus on success – Ensure resources are allocated to products which drive profitability within the business. Provide priority to teams of where to drive most value in their given area.
- Selling Right – Sales teams could be mobilised with a true understanding of what price for a specific customer location and volume is acceptable or not. Targets can be fully aligned to business profitability and not just volume’
- Quick Reaction – changes to raw material prices or changes to the exchange rate can be mapped live. Businesses can understand at a SKU level and keep on the pulse to react and see impact quickly.
- Intelligent Promotions – knowing costs and customers, overlaid with promotional elasticity of demand can remodel and optimise promo activity to drive significant improvements in P&L.
This is all true, and yes, this information would be great at my fingertips, but who has time for more analysis or costly number crunching?
IT’S NOT THAT SIMPLE FOR US
This scenario is not uncommon. The apparently simple, certainly critical and rarely achieved task of accurately calculating true SKU profitability is often lost in a myriad of outdated cost allocations.
Without considering inventory, increased process complexity, high shipping costs and operational impacts, business leaders are not getting the right information of the products they offer to customers to compete in a competitive environment.
If the bottom up allocation of costs to products is not visible, you’re potentially, and cynically, almost certainly losing money on sales you do not know about. This seems a simple formula, however business’ reporting structures and cost centres are not set-up for, nor designed around the value chain, thus cost allocation methodologies are complicated, and visibility of true cost allocation is not clear.
Ideally we would be able to understand true profitability of each SKU or service, sold to each customer from each manufacturing location allowing the business to develop the right product offering at the right price with the right balance between customer service, cost and profit.
SKU profitability analysis, reporting and S&OP integration is the solution. Solutions such as Pollen Consulting Group’s SKU Profitability have a tried and tested methodology and approach to rapidly provide the insights needed to make effective business decisions, integrate at the right level and drive the right strategies for each channel and customer.
Identifying the right strategic choice can be confusing and if not underpinned with the right information can be damaging to the business. Bottom up, accurate SKU profitability can unlock confidence in making the right decisions. The methodology is the key, it can be applied across sectors and market and be applied to whatever product and service is being provided.
THE APPROACH
BOTTOM-UP
By utilising a bottom up approach, costs are understood in detail. Costs are allocated to the correct process/area and then in turn to the relevant products or services. Required changes to business costing methodologies are highlighted to ensure accurate allocation of costs through the entire value chain.
The bottom up approach is a deep dive into the backbone of an operation, building a detailed model of cost allocations in the relevant cost buckets.
Generally, the information is available within a business’ current data sets, it is a question of understanding these sources, cleaning them (or updating) and allocating to the correct element of the value chain. The bottom up approach will identify these gaps and actions to rectify.
TOP DOWN
From a macro level, businesses have a very good handle on profitability. P&L accounting offers little opportunity to hide bottom line profitability, however allocating costs to the wrong buckets can allow certain parts of the P&L to seem more attractive/undesirable. However, at an EBIT level these costs will have to be accounted for through variances or overhead allocation.
How often have you seen large variances in the P&L and not been able to explain where they come from?
True visibility of costs will make sense of the variances and cost allocations within the P&L. The top down financial reporting will validate that the bottom up analysis has included everything. Combining the two approached brings to light the true performance of the business.
The power of this approach is to then leverage the information to determine accurate financial forecasts and understand how to influence profit margin growth. Integration of this clarity into a business’ S&OP process is a powerful tool to driving actionable decision making and strategy based on profitability.
THE TRINITY CORE
SKU profitability analytics is critical to determining the correct strategic choices for a business such as price, cost, volume of product mix.
Through application of the core three lenses analytics can ensure the correct approach is understood. The core lenses to review a business service offering are typically:
- SKU
- Product Group
- Customer
In order to understand the right approach, all lenses need to be considered. For example, when considering a customer, some products within the portfolio may not be profitable, however when the customer is considered as a whole, they may significantly contribute to profitability.
Conversely there may be some products which are not profitable overall, however when applying the customer lense it is identified that this is driven by one specific customer. Removal of this SKU/customer combination will make the SKU profitable.
Application of the product group lense is very insightful. Typically, SKUs within product groups will have similar operational processes. This means that application of focused process improvement can raise the profitability of the whole product group. Product group cost breakdowns will be similar and when costs considered for SKUs within the group relative to each other insight can be gained as to where to focus the improvement. Customers within the product group can also offer insights to where we have pricing issues or the wrong historically driven sales strategy.
ADDITIONAL LENSES
Once core lenses have categorised the SKUs at a high level, there are a series of additional overlay lenses to pinpoint the optimal strategy for each SKU. A few examples include:
CAPACITY
Considering capacity helps understand if volume will fix an allocation issue, or if more volume will actually increase costs due to overtime, or if less volume would actually be more profitable as reduces overtime.
PROMOTIONAL ACTIVITY
Retailers love promotions, and suppliers typically deliver, however how intelligent are those choices. Promotions erode margin and increase volume, thus providing promotions on high margin volume will offer a profit gain. Choosing the wrong product however will erode an already low margin and increase volume to exacerbate the profit loss.
FOREIGN EXCHANGE
If products are exported or use imported raw materials, fluctuations in the exchange rate will drive significant changes in overall profitability. Does the business have a clear strategy or contingency approach (contractual?) to mitigate?
RAW MATERIAL PRICING
Commodity pricing fluctuation has a similar impact, linking the true cost of products to variable rates. Linking SKU profitability to live market rates helps businesses understand the impact to product groups and determine how to maximise profitability. Material Substitutions?
CAPITAL STRATEGY
Future improvements may impact the performance of products. Understanding the future state profitability impact may unlock the ability to sell to different markets or drive revenue with a more attractive price.
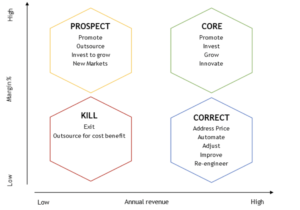
Once true visibility of end-to-end costs can be analysed, the SKUs can be categorised against profit and volume or revenue.
Different strategies should be adopted to different groups. The output of such knowledge is not to stop products, losing revenue and customers but to operate more strategically.
“Need Focus” products, for example, although having low margin and potentially having a negative impact to the businesses bottom line, will be contributing significantly to fixed overheads. In which case losing revenue or sales even if not profitable will create a downward spiral of less and less contribution. Focusing strategy to drive improvements to margin will be the best approach.
GENERATING VALUE
The power of SKU profitability insights can be accessed through front face dash boards at any time. More powerfully is to align the insights generated into the S&OP meetings driving the customer operations.
Easily accessible true cost allocation unlocks:
- Rapid future state scenario modelling
- Clear validated data for strategy development
- Costing structure aligned to business processes not just financial transaction
- Direction for where to focus to most impact business performance
- One truth for all divisions and functions to work from (e.g. Operations and Sales)
This issue cannot be ignored and cannot be underestimated the impact to making the right decisions at all levels of the business. Take action, build the right cost model for your business, see your pain points and focus resource where it will be most impactful.
Oliver North; Director – Pollen Consulting Group